Design, Style and Printing Tips
As a designer of books and covers, I’m always drawn to a good infographic.
As a marketer or soon to be author, you might find yourself needing to create one too – and I came across this great free download – from easel.ly.com. Click here for a free guide to creating inforgaphics.
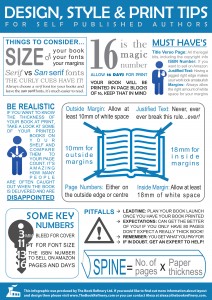
I’ve also included my two inforgraphics that I’ve created – to help you with aspects of your book publishing journey.
Some interesting facts regarding infographics are;
- Publishers of infographics have 12% more traffic, than regular written blogs.
- 90% of the information transmitted to the brain is visual. (And this is quite evident, when posting on sites like Facebook and Twitter – have you notices that posts with interesting pictures get twice the number of likes or comments, then just a status update!)
- Visuals are processed 60,000 times faster than words/text. Pictures are processed simultaneously, whilst written words are processed sequentially. So in this fast paced world, where we are bombarded with information, we only retain a small part of it. A visual representation will be much more evocative, than lots of text.
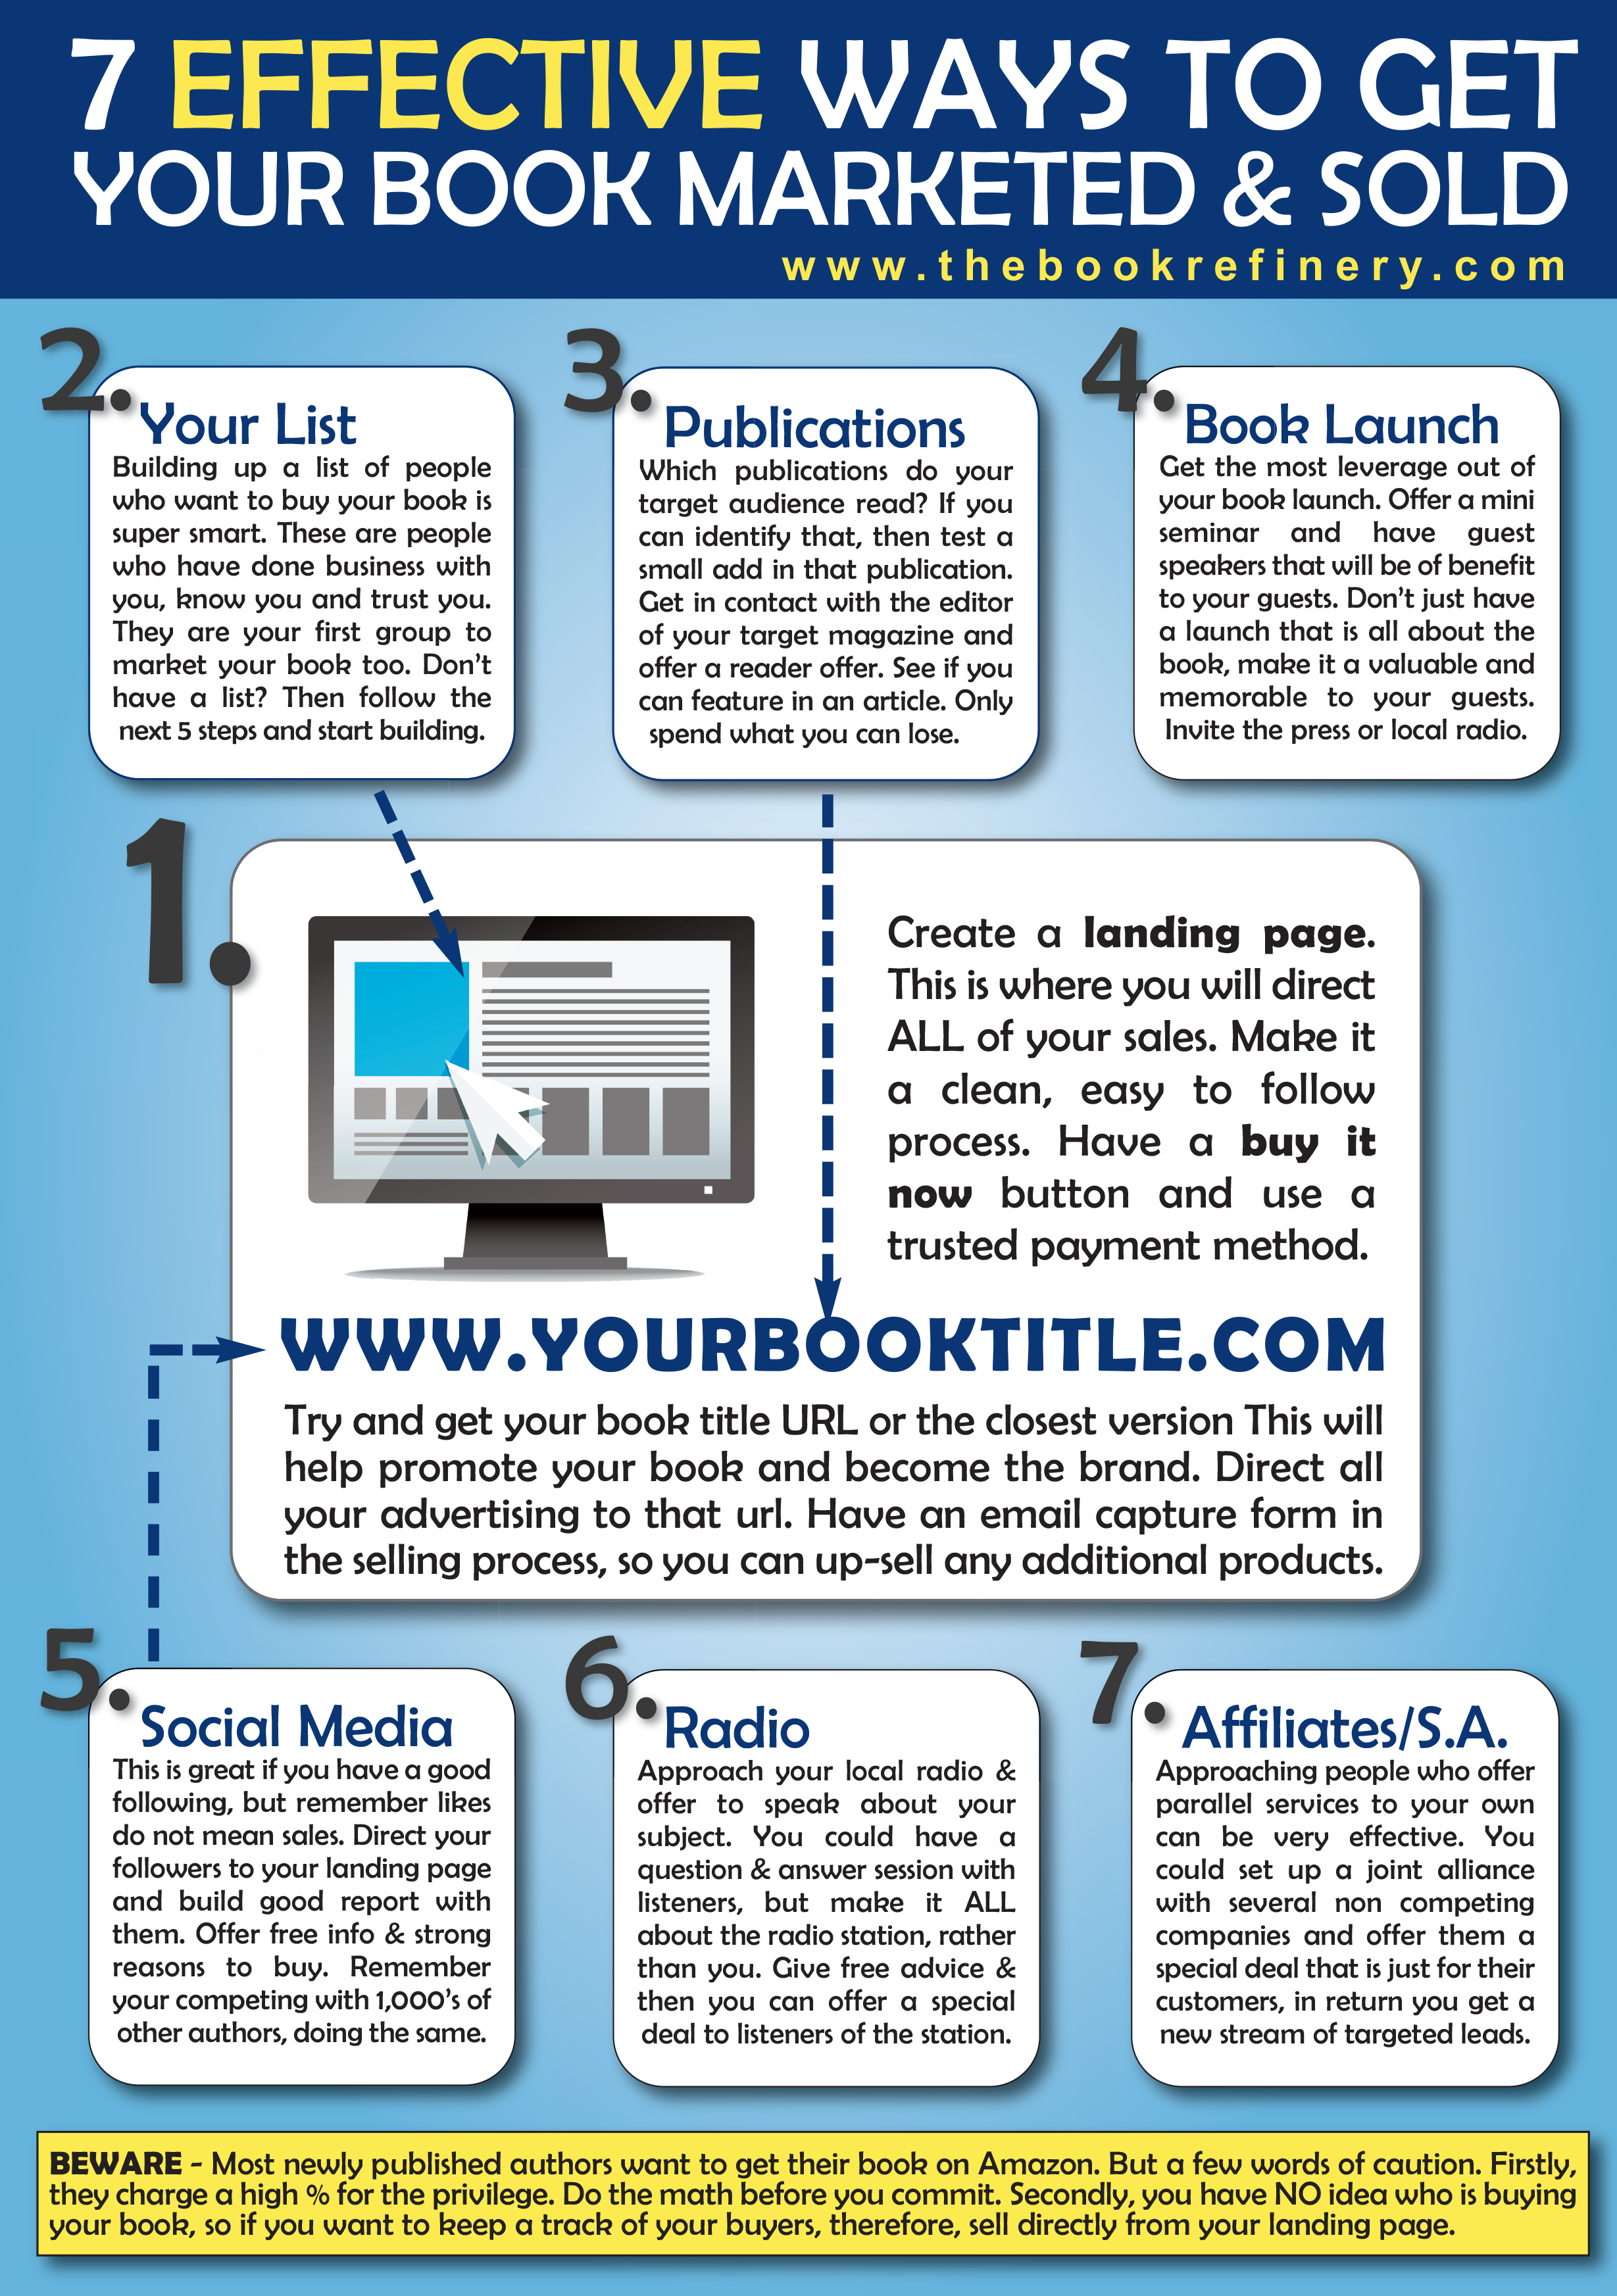
7 Effective Ways to Get your Book Marketed and Sold
You might be also interested to know that infographic search terms have gone up 800% in the past two years (stats from Google).
So, make sure your infographic captures your target audience, and get them coming back for more and if you’re stuck for ideas, go and get the free guide – and create some powerful messages!
I look forward to seeing them on the web!
Have a great Friday!